Model Comparisons
The following table shows the different electricity consumption of popular NLP and Computer visions models
Model |
GPU |
Training Time (H) |
Consumption (kWh) |
|---|---|---|---|
BERTfintetune |
4 V100 |
6 |
3.1 |
BERTpretrain |
8 V100 |
36 |
37.3 |
6BTransf. |
256 A100 |
192 |
13 812.4 |
Dense121 |
1 P40 |
0.3 |
0.02 |
Dense169 |
1 P40 |
0.3 |
0.03 |
Dense201 |
1 P40 |
0.4 |
0.04 |
ViTTiny |
1 V100 |
19 |
1.7 |
ViTSmall |
1 V100 |
19 |
2.2 |
ViTBase |
1 V100 |
21 |
4.7 |
ViTLarge |
4 V100 |
90 |
93.3 |
ViTHuge |
4 V100 |
216 |
237.6 |
Impact of time of year and region
Carbon emissions that would be emitted from training BERT (language modeling on 8 V100s for 36 hours) in different locations:
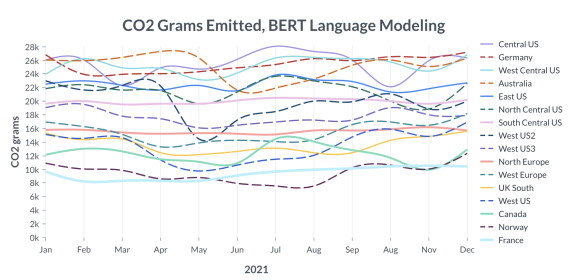
In this case study, time of year might not be relevant in most cases, but localisation can have a great impact on carbon emissions.
Here, and in the graph below, emissions equivalent are estimated using Microsoft Azure cloud tools. CodeCarbon has developed its own measuring tools. The result could be different.
Comparisons
Emissions for the 11 described models can be displayed as below:
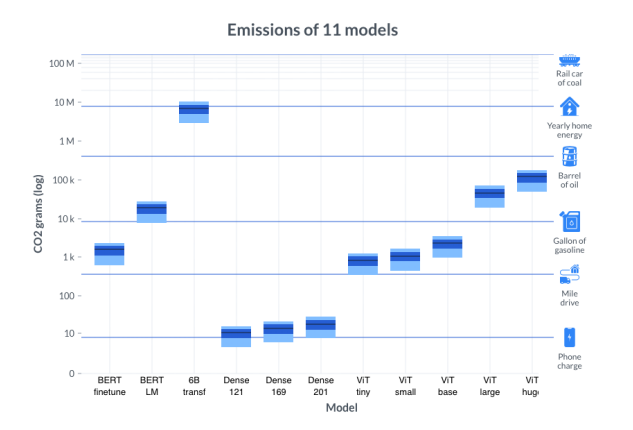
The black line represents the average emissions (across regions and time of year). The light blue represents the first and fourth quartiles. On the right side, equivalent sources of emissions are displayed as comparison points (source : US Environmental Protection Agency). NB : presented on a log scale
References
Measuring the Carbon intensity of AI in Cloud Instance
Another source comparing models carbon intensity: Energy and Policy Considerations for Deep Learning in NLP