Comet Integration
CodeCarbon can be automatically integrated with Comet for experiment tracking and visualization. Comet provides data scientists with powerful tools to track, compare, explain, and reproduce their experiments. Now, with CodeCarbon you can easily track the carbon footprint of your jobs along with your training metrics, hyperparameters, dataset samples, artifacts, and more.
To get started with the Comet-CodeCarbon integration, make sure you have comet-ml installed:
pip install comet_ml>=3.2.2
Go to Comet’s website and create a free account. From your account settings page, copy your personal API key.
In the mnist-comet.py example file, replace the placeholder code with your API key:
experiment = Experiment(api_key="YOUR API KEY")
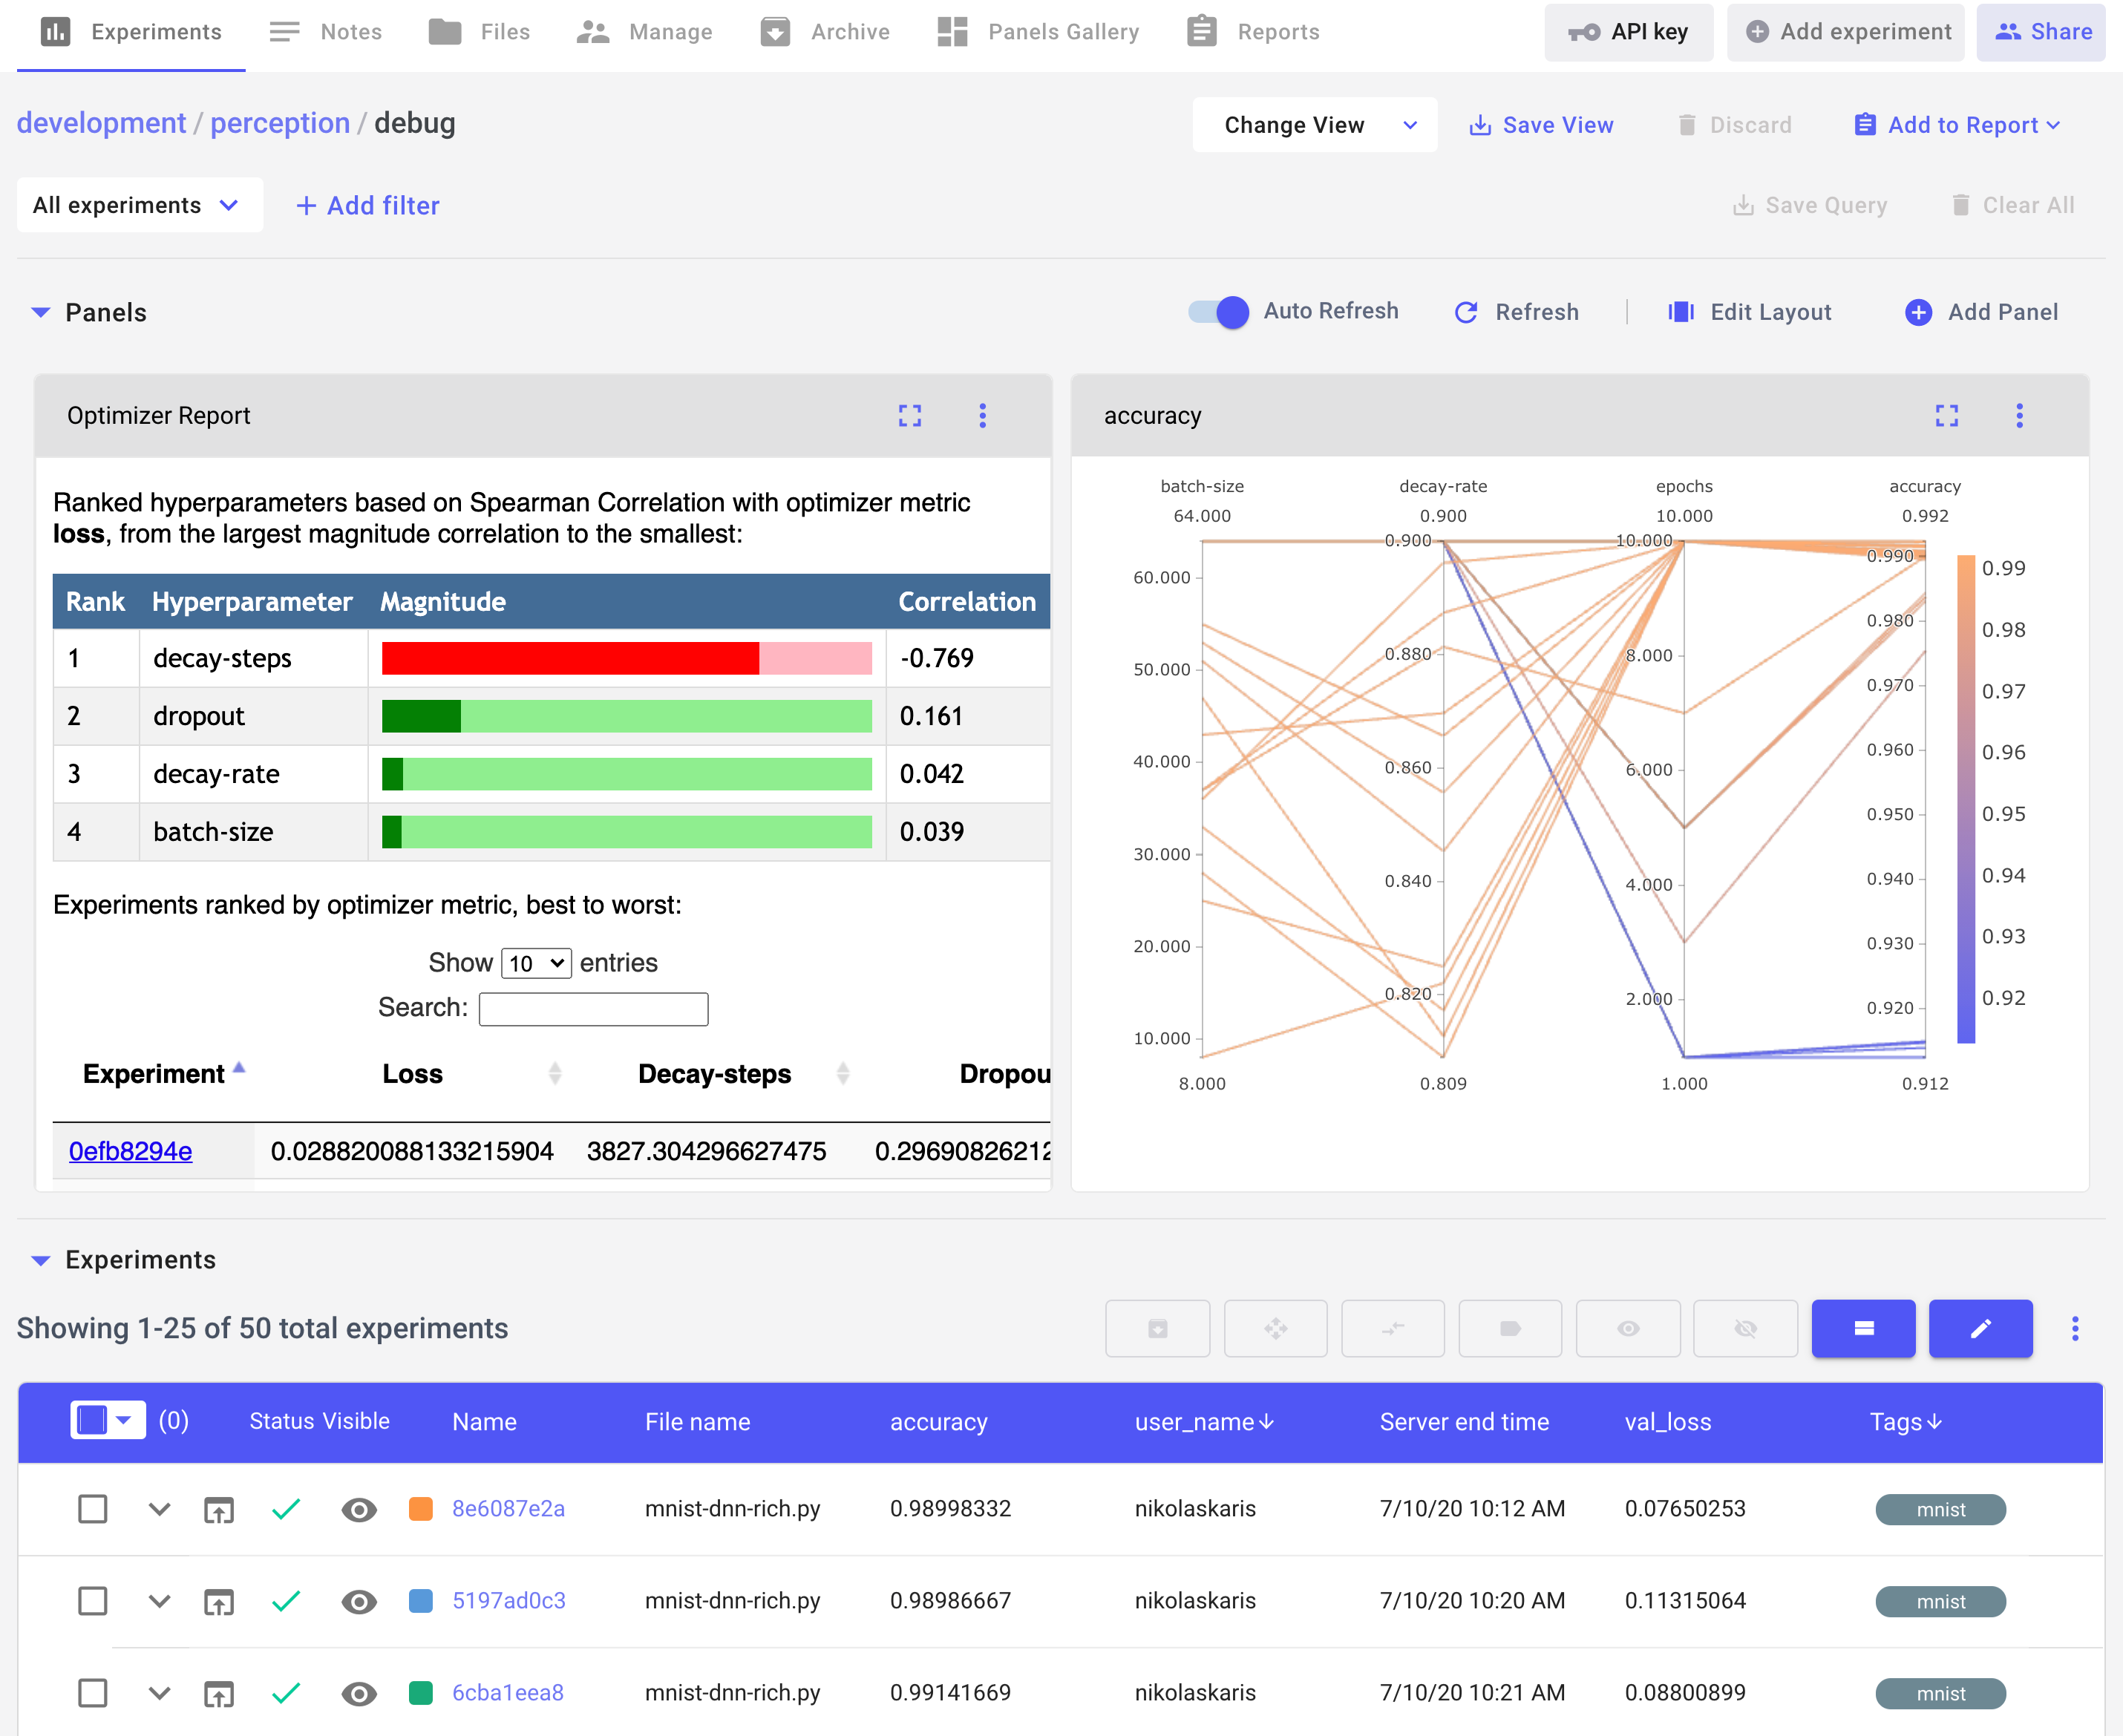
Run your experiment and click on the link in stdout to be taken back to the Comet UI. You’ll automatically see your metrics, hyperparameters, graph definition, system and environment details, and more.
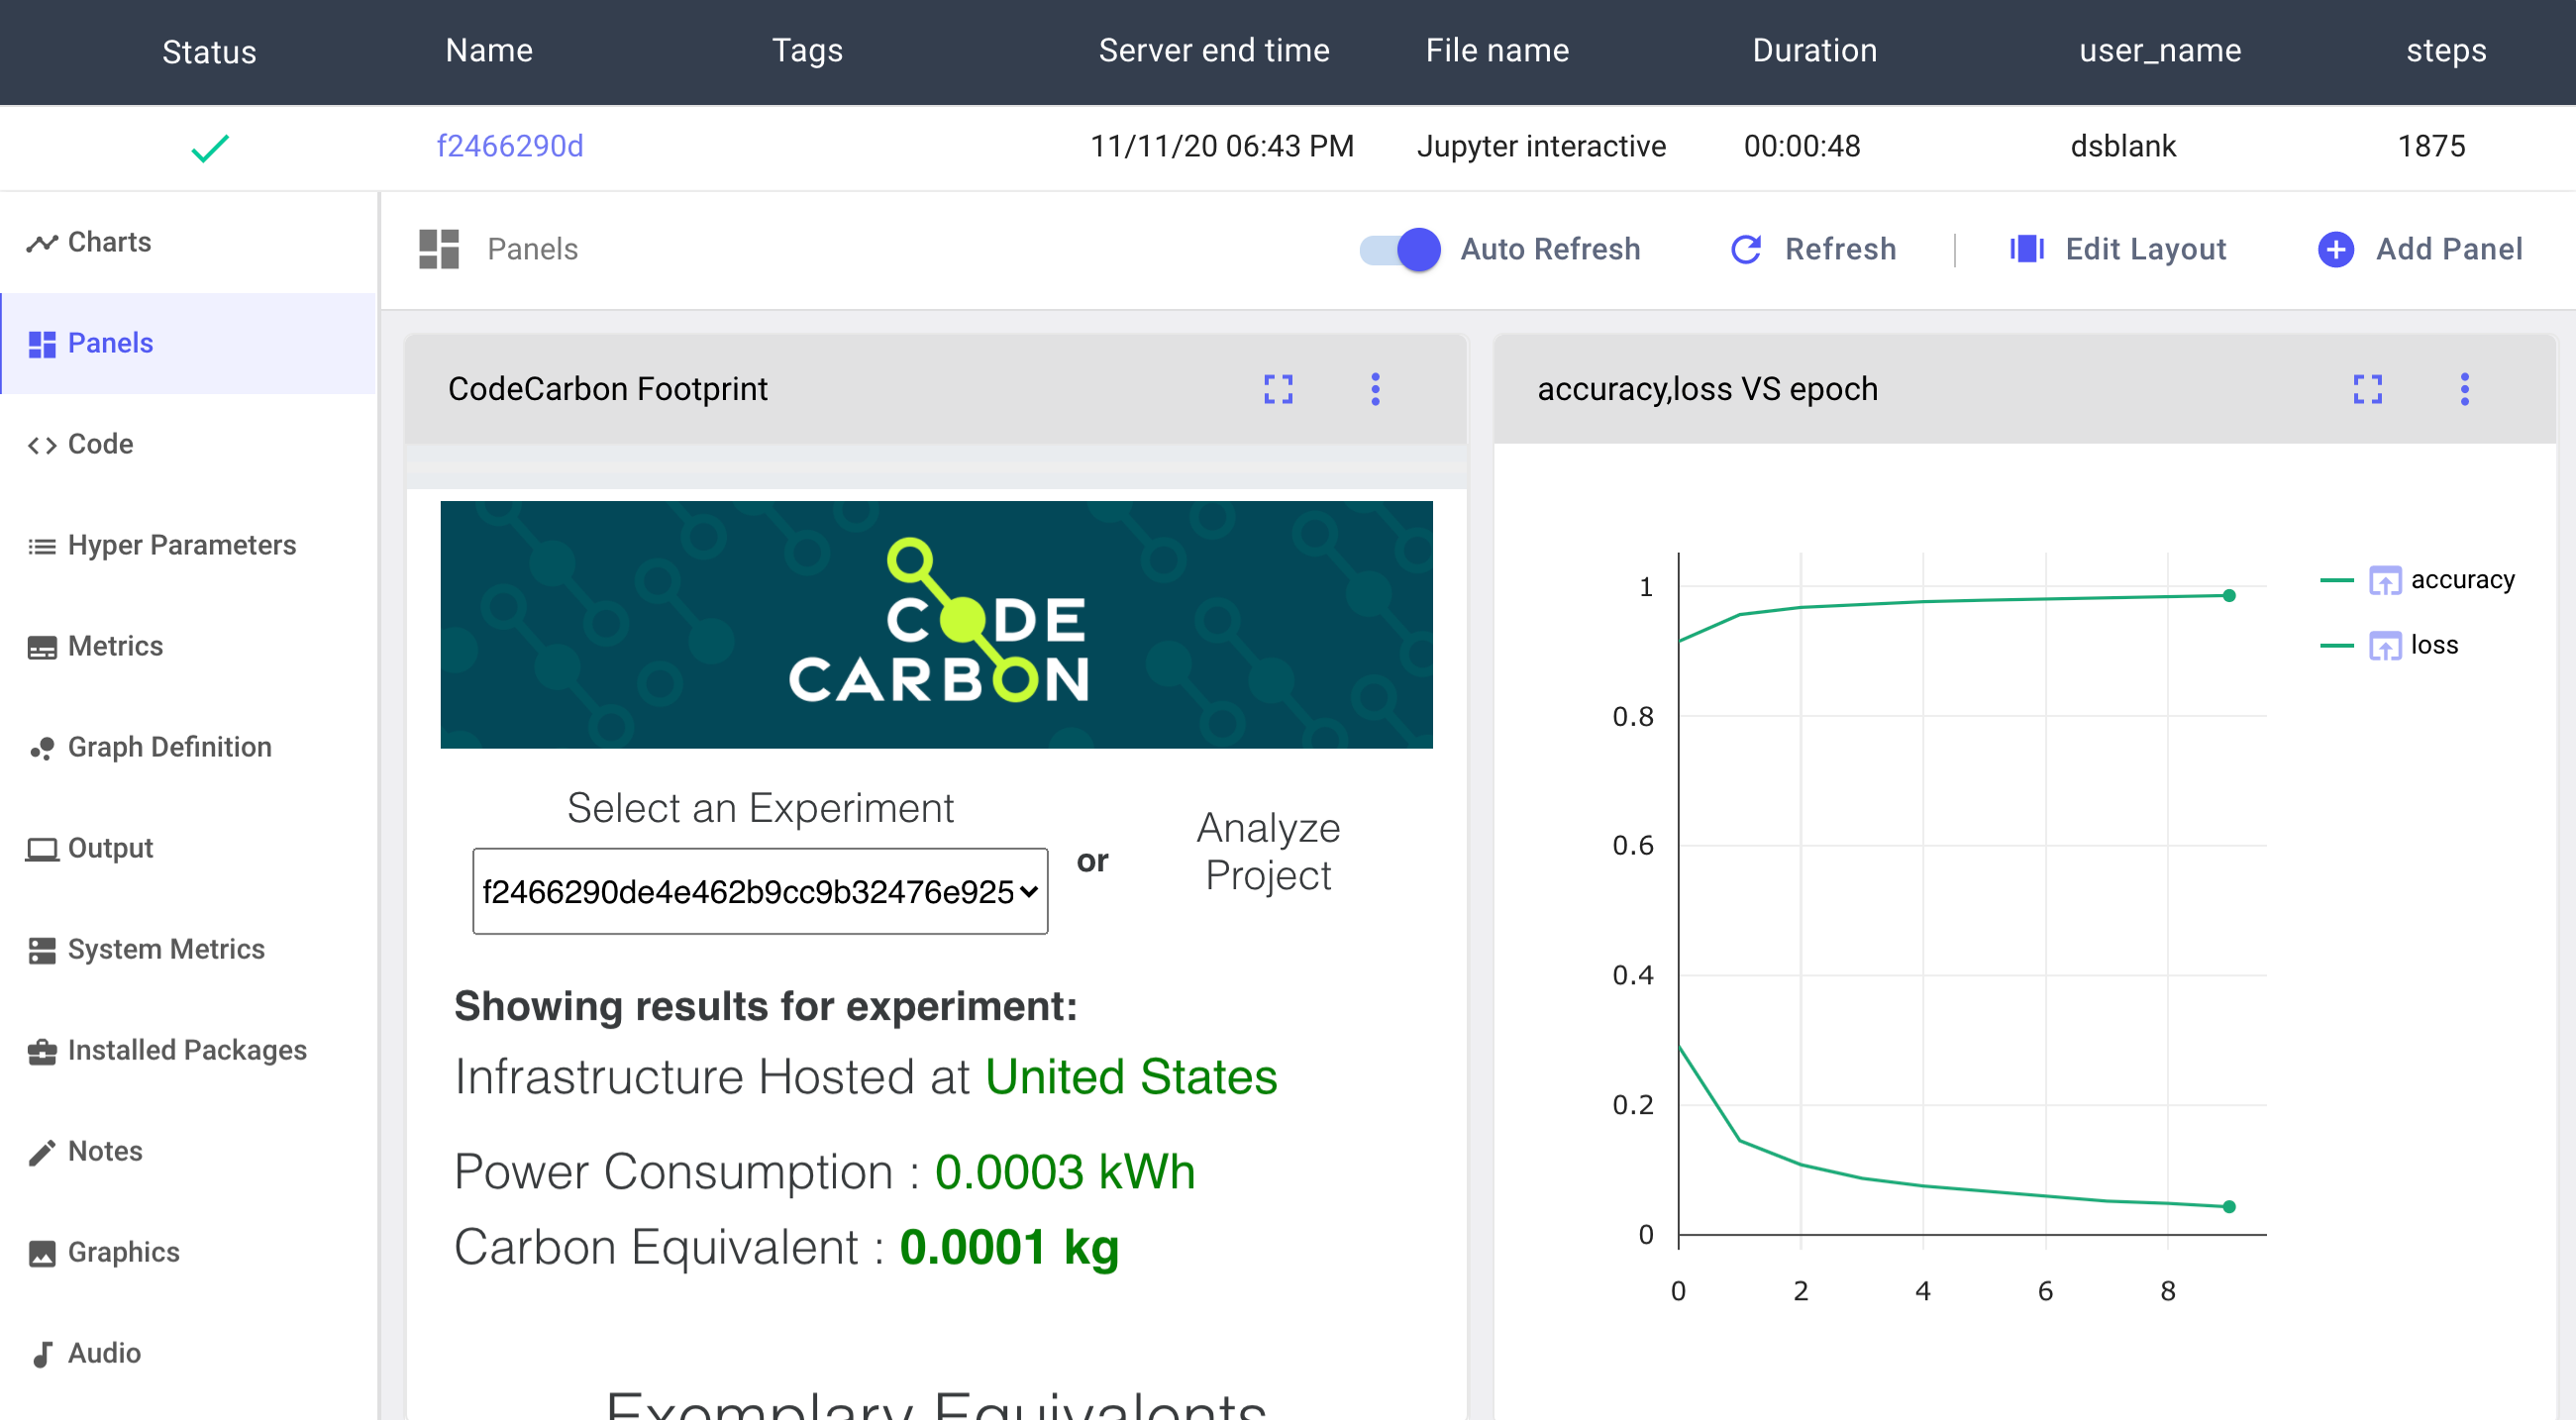
Comet will automatically create an EmissionsTracker object from the codecarbon package when your code runs. To visualize the carbon footprint of your experiment, go to the Panel tab in the left sidebar and click Add Panel.
From the Panel Gallery click the Public tab and search for CodeCarbon Footprint. Once you’ve found it, add it to your Experiment.
Now back in the Panels tab you’ll see your CodeCarbon Footprint visualization in the Comet UI. To render the visualization by default, save your View. And voilà! Every time you run your experiments, you’ll be able to visualize your CodeCarbon emissions data alongside everything else you need to track for your research.